





On September 29, 2017, the Washington-based Migration Policy Institute (MPI, www.migrationpolicy.org) released a research report titled "Chinese Immigrants in the United States." Let's take a look at this latest report with the editors at Worldway Immigration Group:
Chinese Immigrants in the United States
Historically, there have been two waves of Chinese immigration to the United States: the first wave lasted from the 1850s to the 1880s, ending only when federal laws restricted Chinese immigration; following the normalization of U.S.-China relations and changes in immigration policies in both countries, the second wave has lasted from the late 1970s to the present. Chinese immigrants are now the third-largest immigrant group in the United States, following Mexicans and Indians. In 2016, the total number of Chinese immigrants reached 2.3 million, accounting for approximately 5% of the total immigrant population of 44 million.
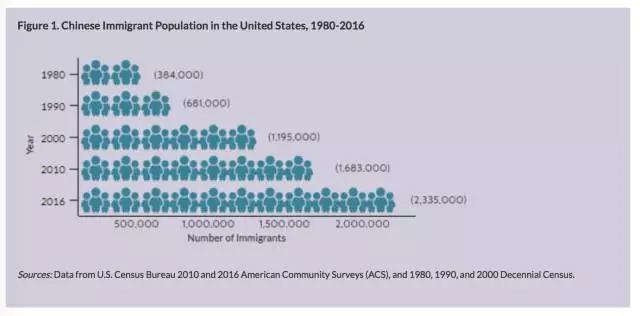
Number of Chinese immigrants in the U.S., 1980-2016
States and Cities with High Concentrations of Chinese
Approximately 50% of Chinese immigrants in the United States reside in California (31%) and New York (20%). Los Angeles, Queens (NY), Kings (NY), and San Francisco counties together account for 28%.
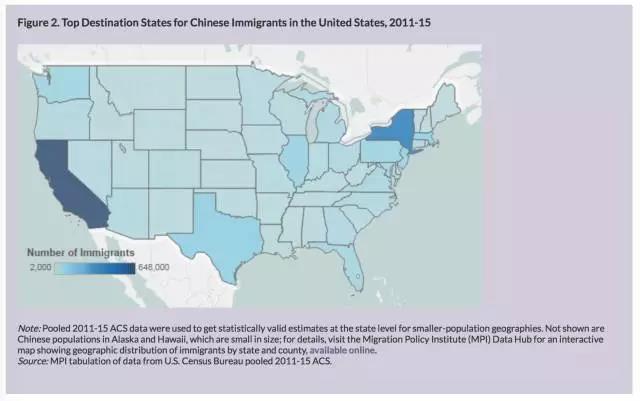
Major U.S. states for Chinese immigrants, 2011-2015
During the 2011-2015 period, the cities with the highest number of Chinese immigrants were the New York, San Francisco, and Los Angeles metropolitan areas. 44% of Chinese immigrants live in these three U.S. metropolitan areas.
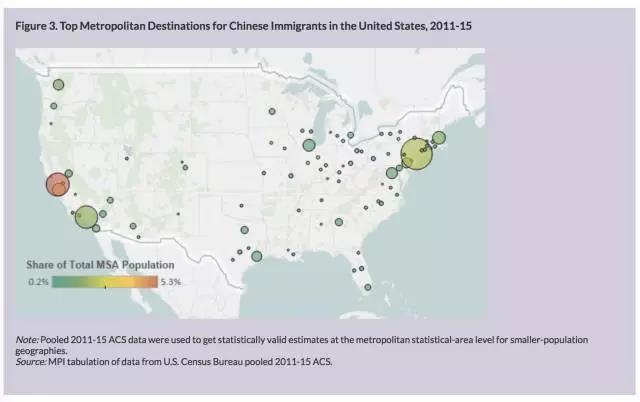
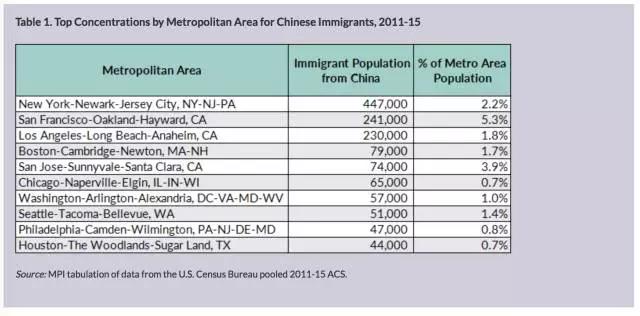
Major U.S. metropolitan areas for Chinese immigrants, 2011-2015
English Proficiency
The English proficiency of Chinese immigrants is relatively weak. In 2016, approximately 61% of Chinese immigrants aged 5 and older had limited English proficiency, compared to only 49% of all immigrants. Only 10% of Chinese immigrants speak only English at home, while the percentage for all immigrants speaking English at home is 16%.
Age, Education, and Employment
In 2016, the median age of Chinese immigrants was 44 (the same as for all immigrants), which is older than the median age of the U.S.-born population (36).
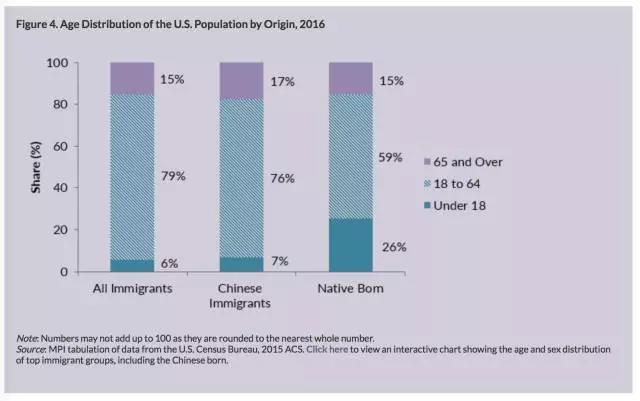
Age distribution of immigrants, 2016

Occupational types in the labor force and immigrant countries of origin, 2016
Income and Poverty
In 2016, the median income of Chinese immigrant households ($56,000) was slightly higher than that of all immigrant households ($54,000) and lower than that of U.S.-born households ($58,000).
Naturalization
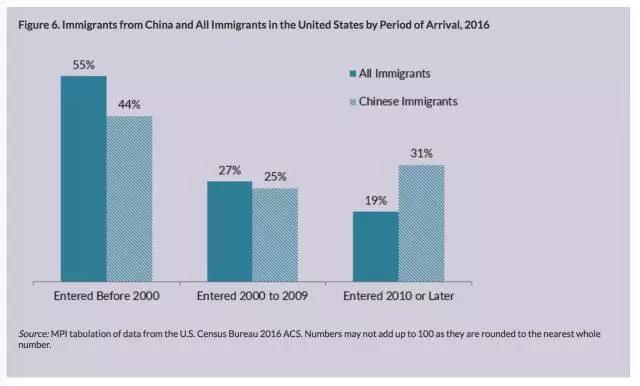
In 2016, out of approximately 2.3 million Chinese immigrants, 51% had naturalized as U.S. citizens, slightly higher than the proportion for all U.S. immigrants (49%). Compared to the overall foreign-born population in the U.S., a larger proportion of Chinese residents entered the U.S. recently, as shown in the chart below. 44% of Chinese residents in the U.S. entered before 2000, 25% entered between 2000 and 2009, and 31% entered after 2010.
Health Insurance
Compared to all immigrants, Chinese immigrants are more likely to purchase private health insurance (67% vs. 56%).
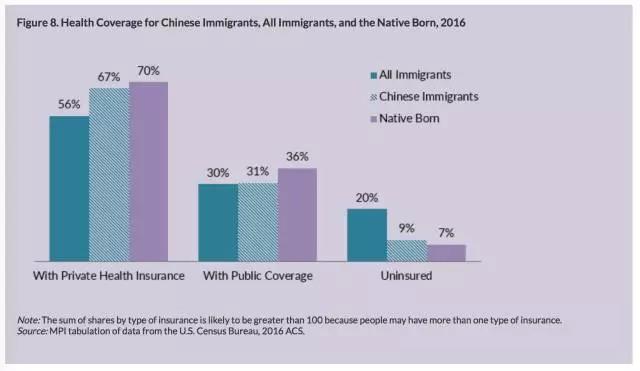
Health insurance coverage rates, 2016
Chinese Identity
Approximately 5 million people are considered to be immigrants born in China or of Chinese descent.
Remittances
China receives the second-highest amount of international migrant remittances in the world (India is first), reaching $61 billion in 2016, accounting for approximately 1% of its GDP.
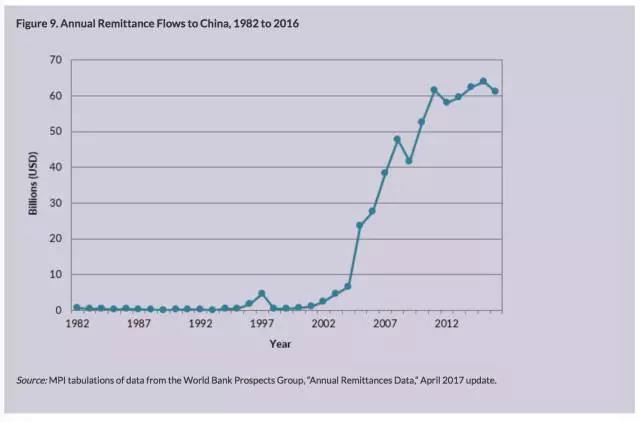
Inward remittances, 1982-2016
As is well known, the United States is the world's economic center and a top-tier educational powerhouse. It attracts a large number of Chinese people with its prosperous charm, superior environment, advanced high-tech industry, and excellent education. The U.S. EB-5 program has relatively low capital requirements, does not require assets to be derived from business operations, and has no language or academic requirements, making it one of the most mainstream ways for Chinese citizens to immigrate to the United States.
Worldway immigration experts remind investors that the current EB-5 investment immigration policy, which requires an investment of only $500,000 and offers a high cost-performance ratio, is about to expire. Worldway Immigration Group is currently offering two high-quality EB-5 projects: "Dallas No. 1," located in the "U.S. Economic Growth Pole" of Dallas and hailed as the "2017 Diamond-Level EB-5 Project." This project will help investors seize the last opportunity for low-cost immigration to the United States. Investors interested in immigrating to the U.S. are advised to seize this final policy dividend period.
Working Together to Create Brilliance, 20 Years of Prestige!

On the occasion of Worldway Immigration Group's 20th anniversary, to thank new and old clients for their support and trust over the past 20 years, we are launching the "Worldway Group 20th Anniversary Celebration, Comprehensive Gratitude Rewards" campaign from now until November 12, 2017. During the event, Worldway Group will offer numerous major discounts to share the joy with investors. For details, please call: 400-138-2929.